
I have just finished exploring what sets high-performing small and medium-sized banks apart from their less successful peers.
We found that winners—those flaunting double-digit returns and growth—strategically manage costs, focus on specific geographies, and commit to their strategies much more effectively than laggards, who are stuck in the single digits on growth and returns.
One question we recently examined was how the Net Interest Margins of these banks have behaved over the past 5 years, and there are several surprises there.
NIM: Where the Action Is
One big question I recently tackled: how have these banks’ Net Interest Margins (NIM) stacked up over the past five years?
Grab your popcorn, because the results are juicier than a quarterly earnings call after a good year.
What’s NIM?
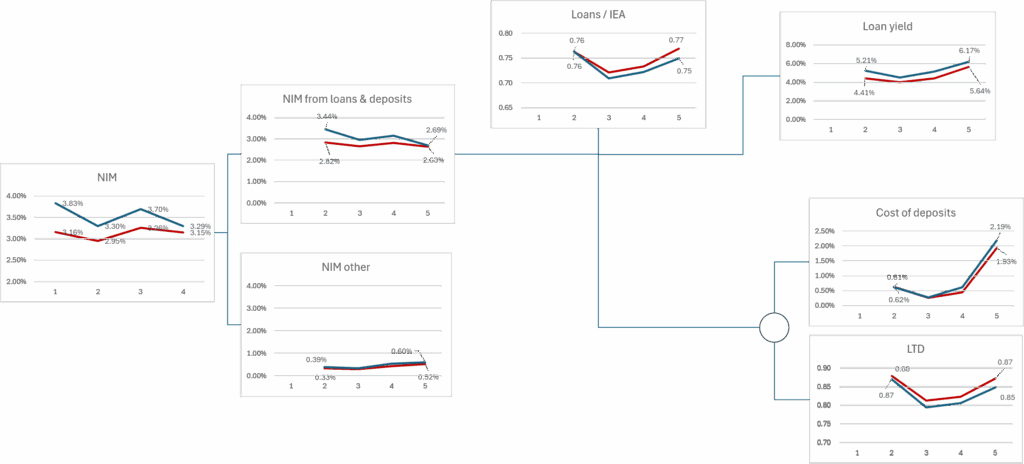
The Net Interest Margin is the ultimate litmus test for how effectively a bank converts low-cost funding into high-yield assets. In other words, it’s the core engine room. Calculated as Net Interest Income (what you earn in interest minus what you pay), divided by total interest-earning assets.
Where it becomes interesting is when we decompose the NIM into its key drivers, each one of which reflects different strategic choices:
- Loan Yield, which reflects the choices of which markets and types of loans the bank is engaged in, as well as its appetite and ability to manage risks. Does it lend to individuals, small businesses, middle-market companies or enterprises? How much real estate risk is it comfortable with? Etc. Each of these choices defines different asset classes, credit risk spreads and, consequently, yields.
- Cost of Deposits reflects the choices of how the bank will fund its business. Does it have retail branches? How much does depth of relationships translate into lower deposit costs and betas? How does it use brokered deposits?
- Loan-to-Deposit Ratio (LTD) and Loans to Interest-Earning Assets reflect how effective the bank is at originating the types of loans it wants and how much financial risk it feels comfortable with, given its funding strategy.
- NIM from Other Assets/Liabilities is a catch-all category resulting from other assets and liabilities that, when managed poorly, broadcasts a nice-looking red flag to the World.
The Last Five Years: A Tale of Two Types
A Few Headlines from the Data:
- Winners have better NIMs...
As expected, winning banks maintained their NIM significantly above that of the laggards, about 40 bps.
Considering that, as a rule of thumb, banks need ~100 bps of NIM just to pay their cost of capital, a 40 bps spread is significant and leaves the bank with a lot of room to maneuver strategically while still keeping shareholders happy. - … but for how long?
Winners still maintain NIM leadership, but the comfort blanket is getting thinner.
Why? Because laggards are closing the gap not by getting better at lending but by stretching their funding models and risk appetite. Yes, that’s as dangerous as it sounds. - “Other assets and liabilities” is not so relevant… until it is
While the impact of different management of other assets and liabilities in 2019 contributed to only 7% of the difference between winners and laggards, it accounted for almost half of it by 2023. - Loan Yields is where Winners are made
Despite slightly higher deposit costs (26 bps more by 2023) and lower Loan-to-Deposit ratios (2% lower by 2023), winners were able to generate superior results by growing more profitable segments.
As a result, the difference in spreads by 2023 was 53 bps, which is equivalent to a full credit risk level.
Winner’s DNA: Strategic, Selective, and Specialized
Here’s another way to look at it: banks with the lowest cost base, a clear focus (often urban-centric), and strategic discipline aren’t just likely to win—they’re two to three times more likely to win than the rest. That’s not just a trend; it’s a drumbeat.
- Maintaining profitability in higher-risk classes requires strategic specialization.
From how to manage risks in the portfolio effectively to how to originate and fund good deals without getting stuck in slow, over-conservative decision-making or running into risk or regulatory limits. Specialization takes time to build and fine-tune.
You can’t keep outperforming by being a “cowboy” (taking wild risks) or a “chicken flight” (big bursts of growth before hitting constraints). Sustained high performance is about building a machine, not riding a winning streak. Building it requires focus and commitment. - Winners and Whiners Play Different Games
As I mentioned, loan spreads have been the key driver of the difference between winners and laggards.
And, while the difference in NIM has been compressing, the interesting thing is that the difference in loan spreads have not changed that much – from 80 to 53 bps.
This compression has been driven by other factors: laggards are taking more loans compared to deposit growth and paying less for deposits. Relatively taking more financial and liquidity risk, rather than credit risk.
No wonder! Incremental credit risk requires specialization and management, while incremental financial and liquidity risks require mostly appetite. Quality also requires being more selective. - Can you take an inorganic jump from the red to the blue line?
This begs the question: if so much of the performance of winners is driven by strategic focus, commitment, and specialization, which are factors which can be “imported” from an acquired bank, can you use acquisitions to leapfrog to the winners’ club?
Our research shows that just acquiring banks does not make a winner. Winners involved in M&A have a serious commitment to that and the numbers to back it up.
However, I am not talking about acquiring banks to grow your business – but rather, the idea of acquiring other banks to transform it. Find “winners” with specialized strategies in areas you want to develop and use the acquisition to import their best practices, brand, people, processes, and culture.
The Takeaway: Focus Beats Flailing
In community banking, NIM is the temperature check. But how you achieve your margin matters just as much as the number itself. The winners are laser-focused, strategic, and committed to their lane. The whiners, well—they’re still looking for shortcuts, but the market keeps catching up with them.
Ready to move your bank from the red line to the blue? The formula is there—focus, specialize, execute, and stay just cheeky enough not to get comfortable.

Let us help you achieve greater and more profitable growth HERE.