Let us help you achieve greater and more profitable growth. Click here.

Financial services leaders often overlook the importance of your decision regarding which segments, markets, channels, and products to focus on.
One of the reasons is that, while money moves freely, the effort to build channels, brands, products, trust, relationships, and physical infrastructure, can be humongous. Large insurance companies can take more than a year to implement simple changes to existing products.
Thus, short of dramatic strategic moves like divestitures, acquisitions or expansions, the business of a financial services company seems relatively pre-determined.
If you invested years building a business in, for example, private banking, chances are that you will provide private banking products to your customers next year.
Of course, if there is a tectonic shift, like the one we experienced when the COVID pandemic hit, you may re-think your business.
However, there is compelling evidence that choosing the right segment-market-product-channel is the most impactful decision you will make.
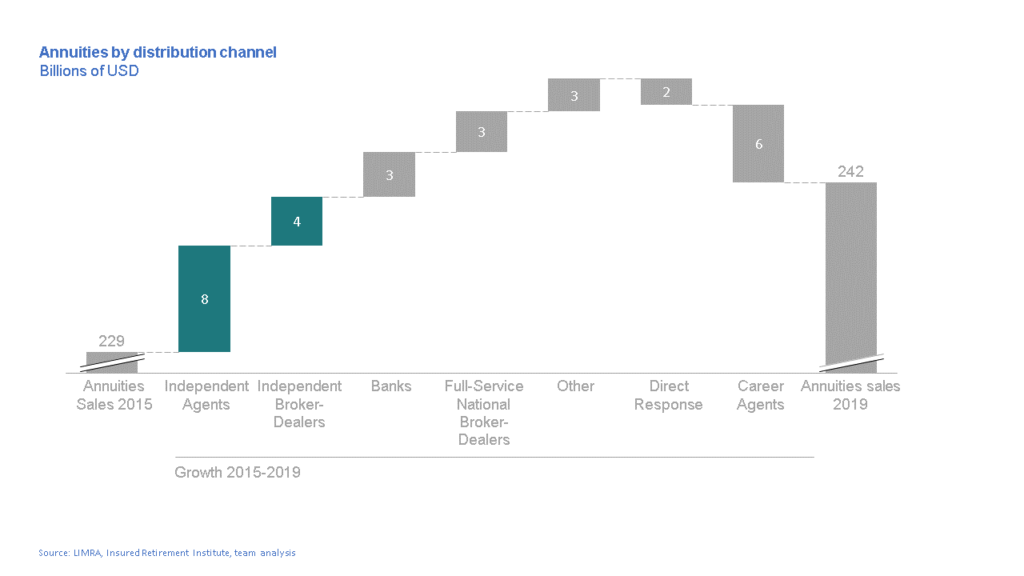
Take the example of annuities. From 2015 to 2019, independent agents and independent broker-dealers accounted for more than 90% of the growth of this product in the US. Agents accounted for two-thirds of this growth and broker-dealers for the remaining one-third.
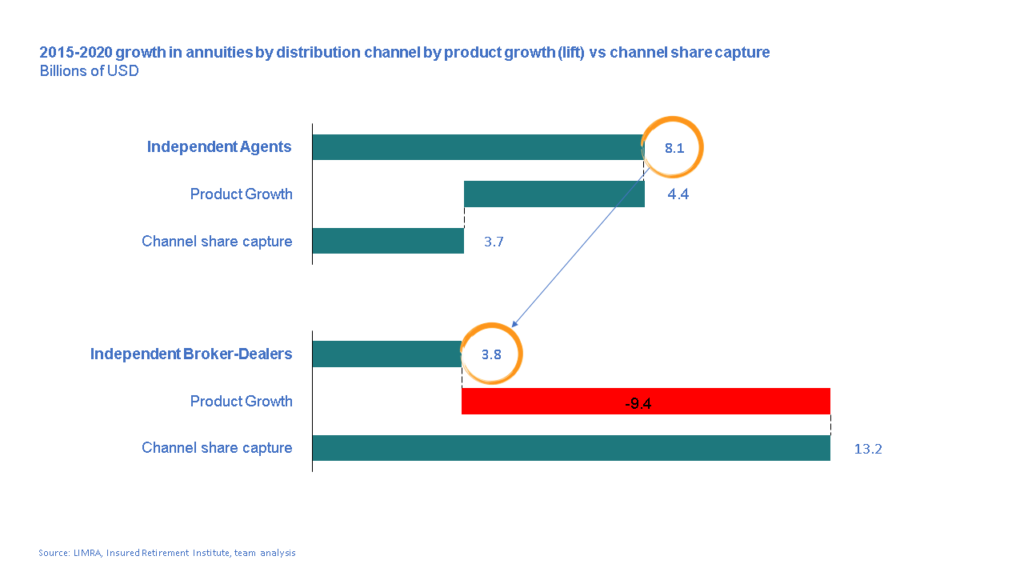
However, upon closer examination, these two channels exhibited very different behaviours. Independent agents benefitted from strong product tailwinds. As a result, we can attribute over $4.4 billion – half of their growth to product growth (the proverbial “tide that lifts all boats”) and only $3.7 billion to channel share capture (the proverbial “eating someone else’s fish”).
On the other hand, broker-dealers – a channel that grew only half as much as agents in total, increased by an astonishing $13 .2 billion from channel capture. This channel was highly competitive and successful. Yet, their strongest products severely underperformed and shrunk by $9.4 bi. As a result, they had to row twice as hard just to stay in place. And, in the end, despite capturing 3x the channel share captured by agents, they grew only half as much in total.
We have observed a similar dynamic in most markets we analyzed, and my clients have saved hundreds of millions of dollars by better re-allocating their business efforts accordingly.
McKinsey, in a comprehensive multi-sector study, has concluded that a company’s choice of where to compete, accounts for sixty percent of its growth – the only notable exception being the technology sector.
So… how do you do it?
- First, triangulate your historical market data. In the annuities example above, looking at the channel or product data alone would result in a superficial answer. However, combining product, channel, market (e.g. geography), and segment (e.g. demographics or industry segment) provides valuable insights of opportunities to explore and underperformers to de-emphasize.
- Compare this triangulated data with your organization’s historical results. For example, a client was happy with their growth until we pointed out that their main channel partners were growing at a much higher rate, which implied they were losing business share. In response, we created a program to strengthen their relationships with these partners and revert this trend.
- Fast forward these historical trends. Forecasting is always tricky, but disaggregating trends makes them easier to understand, track and react. For example, a bank with a robust C&I loan business will have better insights if they analyze their main sectors, channels, products, and combinations separately.
- Determine the implications of these trends to your business and your plans. Which opportunities are emerging? Which areas need de-emphasizing? When do these trends become so drastic that you should reposition through acquisitions, divestitures, expansions or sunsetting?
- Define adequate governance for the key indicators in this plan. How often are they to be tracked? What are the implications for deviations? For example, many financial services companies realized with COVID that they needed to refresh their models much more frequently. As a result, nowcasting capabilities and governance became a critical competitive advantage.